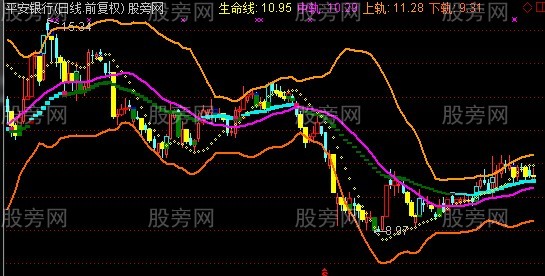
Y1:=10;
B0:=REF(CLOSE - OPEN,2);
B1:=REF(CLOSE,1);
B2:=REF(CLOSE,2);
B3:=REF(CLOSE,3);
B4:=REF(CLOSE,4);
CMAX:=MAX(MAX(MAX(CLOSE,B1),B2),B3);
CMIN:=MIN(MIN(MIN(CLOSE,B1),B2),B3);
红色持股:STICKLINE((CLOSE = CMAX) and (B1 >= B2) or (B1 >= B3) or (B1 = CMAX) and (B2 = CMIN) or (B3 = CMIN) and (CLOSE >= B2) or (B2 = CMAX) and (B3 = CMIN) and (CLOSE >= B1) or (B3 = CMAX) and (CLOSE >= B1) and (CLOSE >= B2),B1,CLOSE,5,1),colorred;
品红变盘:STICKLINE((CLOSE = CMAX) and (B1 = CMIN),B2,CLOSE,5,1),ColorF0F000;
黄色下跌:STICKLINE((CLOSE = CMIN) and (B1 < B2) or (B1 < B3) or (B1 = CMIN) and (B2 = CMAX) or (B3 = CMAX) and (CLOSE < B2) or (B2 = CMIN) and (B3 = CMAX) and (CLOSE < B1) or (B3 = CMIN) and (CLOSE < B1) and (CLOSE < B2),B1,CLOSE,5,0),coloryellow;
绿色买:STICKLINE((B1 = CMAX) and (CLOSE = CMIN),B2,CLOSE,5,0),Color008000;
STICKLINE((B1 = CMIN) and (CLOSE >= B2) or (B2 = CMIN) and (B1 <= B3) or (B3 = CMIN) and (B1 <= B2) and (B2 < B4) and (CLOSE >= B1),B1,B2,5,0),Color008000;
兰色抛售:STICKLINE((B1 = CMAX) and (CLOSE < B2) or (B2 = CMAX) and (B1 > B3) or (B3 = CMAX) and (B1 > B2) and (B2 >= B4) and (CLOSE < B1),B1,B2,5,1),ColorFF0000;
A1:=SAR(5,1,5);
YS1:=EMA(CLOSE,30);
YS2:=IF((CLOSE > 450),8,IF((CLOSE >= 20) and (CLOSE < 150),0.2,IF((CLOSE < 20) and (CLOSE >= 10),0.07,IF((CLOSE < 10),0.03,0.07))));
彩龙:STICKLINE((CLOSE > A1),YS1,YS1 + YS2,6,0),ColorF0F000;
STICKLINE((CLOSE < A1),YS1,YS1 - YS2,6,0),Color006600;
STICKLINE(crOSS(CLOSE,A1),YS1,YS1 - YS2,6,0),Color000080;
STICKLINE(CROSS(A1,CLOSE),YS1,YS1 + YS2,6,0),Color6600FF;
生命线:FORCAST(CLOSE,30),circledot,coloryellow;
支撑:=(MA(CLOSE,13))*(0.955);
中轨:MA(CLOSE,26),Linethick2,ColorFF00FF;
上轨:中轨 + (2)*(STD(CLOSE,26)),Linethick2,Color0099FF;
下轨:中轨 - (2)*(STD(CLOSE,26)),Linethick2,Color0066FF;

